Real estate recruiting software that predicts agent movement | BrokerMetrics 2026
Most brokerages are still recruiting like it’s 2016, and in 2026 that’s a real disadvantage. Forward-thinking leaders use production-based insights and tools like the Agent Movement feature in Proficiency Metrics in Lone Wolf BrokerMetrics to track where agents and their volume are headed before the rest of the market catches on.
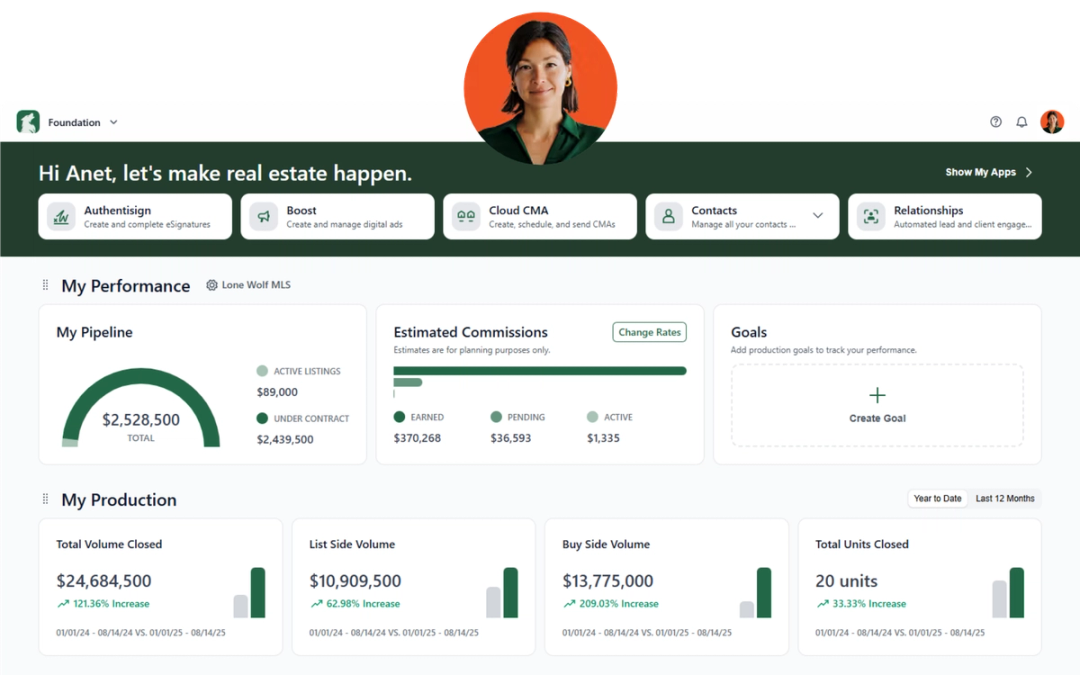
Get powerful data‑driven recruiting with BrokerMetrics.
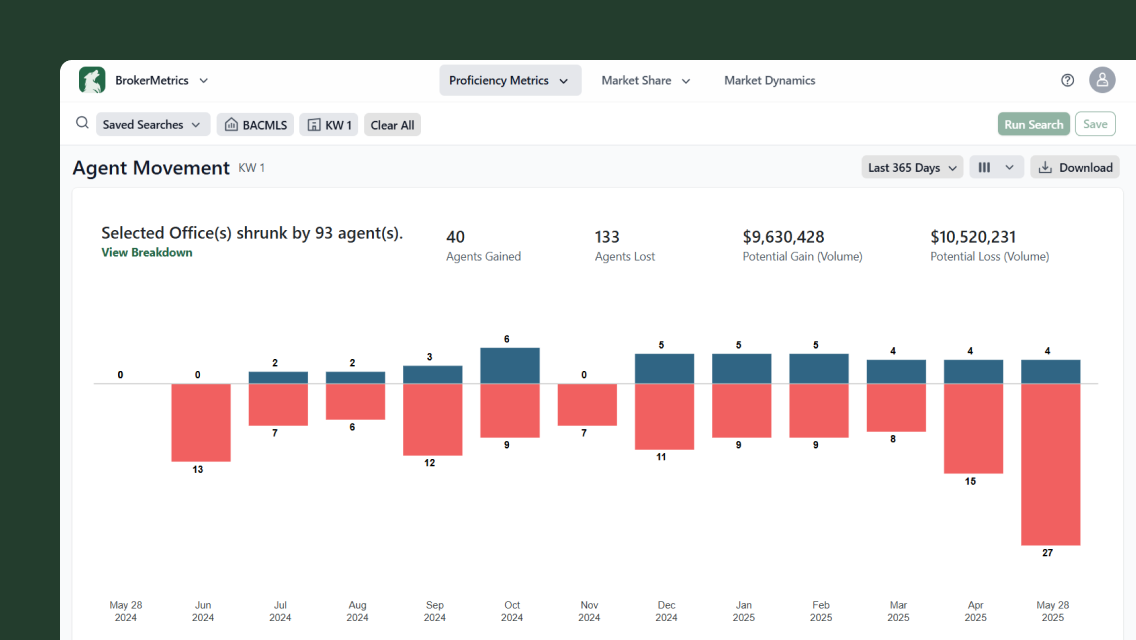
- Agent Movement in Lone Wolf BrokerMetrics shows real movement with real estate analytics that tracks where agents and their production are going—not just who changed offices.
- Data‑driven real estate recruiting software replaces static call lists with live agent movement insights, production trends, and group move signals.
- Agent Movement adds market analysis by layering real estate market analysis tools on MLS data so you can see which offices, teams, and brands are gaining or losing volume.
- It powers recruiting and retention by strengthening brokerage agent retention and giving leaders a playbook for how to recruit real estate agents using timely production and risk signals.
The market is moving faster than your playbook.
Across four of the nation’s largest MLSs, roughly 300,000 agents are projected to move in 2026, a nearly 7% increase over the prior year, with Q1 2026 hitting a six‑quarter high. Every quarter, about $16 billion in annualized production changes hands between brands, and agents are now 13–35% more likely to switch brokerages than they were just 90 days earlier in many markets.
A few realities every brokerage leader should have on their dashboard:
- Agent movement is happening every month—January is the universal peak, and April is a clear secondary peak, but there is no “off-season” for recruiting.
- Only about 20% of agents in production show up every single quarter; the other 80% move in and out like a roller coaster, depending heavily on leadership and accountability.
- Group moves (five or more agents moving together) just hit a six‑quarter high, representing nearly one-fifth of all volume in motion in Q1 2026.
In that environment, intuition and static spreadsheets are not enough. Agent Movement in BrokerMetrics becomes a strategic lever rather than just another report, turning your real estate analytics software into an engine for recruiting and retention.

Why traditional recruiting lists fail (even with real estate recruiting software)
Most recruiting strategies still revolve around a simple rule: pull a list of agents whose production has dropped and call them first, even when you have access to powerful real estate recruiting software. The problem is that the data shows this misses almost half the true opportunity.
- About 44% of agents who moved in Q1 2026 were actually growing production before they switched.
- Roughly 35% of recruits arrive already in a production decline, needing intervention, not a gift basket and generic onboarding.
- The “average” mover volume (around $4.27M) is inflated by a handful of top producers; the median mover is closer to $2.4M, with 56% of movers doing $1–$4M per year.
Operationally, that means:
- If your recruiting list only targets agents in decline, you’re missing high-momentum movers who are being recruited away, not pushed out.
- If you manage to head count instead of production, you can easily end up celebrating growth while one team still quietly controls 30–40% of an office’s volume—a group move in waiting.
How Agent Movement turns data into recruiting strategy
Agent Movement is designed to answer the questions that matter most to real estate brokerage growth: who is moving, where they’re going, and what that means in dollars, not just headcount—essentially showing you how to recruit real estate agents using real data instead of guesswork.
Here’s how it supports better agent recruiting and retention:
| Use case | What you see | What you do with it |
|---|---|---|
| Track agent gains/losses | Offices gaining or losing agents and related production. | Focus leadership on high-performing and at-risk offices based on production impact. |
| Spot recruiting opportunities | Offices/markets losing productive agents, competitor wins. | Build recruiting target lists and respond strategically to competitor attraction. |
| Identify retention risks early | Declines in listing-side activity and production trends. | Intervene with at-risk agents/teams and strengthen retention efforts proactively. |
The result: You see it coming early enough to retain the agent or plan for the volume before it leaves.
Connecting movement to dollar impact, not just headcount
The shift for brokerages is moving from “How many agents did we gain?” to “What was the production and revenue impact?”
Agent Movement helps you:
Quantify revenue impact per move: See each agent’s annualized production and estimate GCI impact instead of treating all moves equally. Team moves can represent $18–$25M in annualized production.
Evaluate office performance by production quality: Layer production over movement to distinguish offices growing through high producers versus those adding low- or zero-production agents and focus investment accordingly.
Align recruiting with real market activity: Most movers fall in the $1–$4M production range, helping you calibrate recruiting offers and strategy around where movement happens.
In short, Agent Movement ties recruiting decisions to production and revenue, so growth is measured in dollars, not headcount.

Turning insights into action: A 90‑day plan for how to recruit real estate agents and retain them
Data only matters if it shapes your next 90 days. Here’s how a brokerage can put Agent Movement to work in the next 90 days:
- Days 1–30: Identify risk and opportunity
- Map agent gains and losses by office over the last two to four quarters.
- Flag high-concentration offices where a single team drives 30–40% of production.
- Build a recruiting list focused on $1–$4M agents showing momentum or declining listing ratios.
- Days 31–60: Act on retention and recruiting signals
- Hold retention conversations with agents showing declining production or listing activity.
- Segment recruiting targets into “under pressure” vs. “moving from strength” and tailor onboarding and support accordingly.
- Days 61–90: Execute and support leaders
- Focus recruiting efforts around peak movement periods (January and April), while maintaining year-round activity.
- Equip high-risk offices with targeted recruiting lists and retention plans, and review progress monthly.
Done consistently, this turns BrokerMetrics from a reporting tool into a living real estate analytics software platform that shapes daily recruiting, retention, and leadership decisions.
Ready to recruit smarter? See Agent Movement in BrokerMetrics in action.
The takeaway is simple: the market is migrating toward data-driven brokerages that understand exactly who is moving, where they’re going, and what each move is worth.
Agent Movement surfaces:
- Net agent and volume movement by office and month
- Recruiting and attrition patterns across your market
- Dollar impact behind each move
- High-performing and high-risk offices in real time
For brokers focused on growth, the advantage is no longer effort—it’s visibility. With Agent Movement, you can act earlier, use your real estate recruiting software more strategically, and protect what you’ve built.
Other resources
See more eBooks, webinars, and blog articles to help you stay ahead with strategies designed for your success.